|
|
| (13 intermediate revisions by one user not shown) |
| Line 1: |
Line 1: |
| | | | |
| − | '''Water Storage'''
| + | Water storage is the conservation of surplus water that is collected and stored by means of [[Water_harvesting|water harvesting]] techniques. “Water harvesting in its broadest sense will be defined [here] as the ‘collection of runoff for its productive use’.”[http://agriwaterpedia.info/index.php?title=Water_Storage&action=edit&mode=wysiwyg&redlink=1#_ftn1 [1]] |
| | | | |
| − | Water storage is the conservation of surplus water that is collected and stored by means of [[Water harvesting|water harvesting]] techniques. “Water harvesting in its broadest sense will be defined [here] as the ‘collection of runoff for its productive use’.”[http://agriwaterpedia.info/index.php?title=Water_Storage&action=edit&mode=wysiwyg&redlink=1#_ftn1 [1]] Stored water can either be used for drinking water or for irrigation purposes. For the latter, stored water is used to cover the demand of crops during the dry season or even during dry spells in the rainy season and thereby prolong the cropping period.[http://agriwaterpedia.info/index.php?title=Water_Storage&action=edit&mode=wysiwyg&redlink=1#_ftn2 [2]]
| + | === Water Storage === |
| | + | |
| | + | Stored water can either be used for drinking water or for irrigation purposes. For the latter, stored water is used to cover the demand of crops during the dry season or even during dry spells in the rainy season and thereby prolong the cropping period.[http://agriwaterpedia.info/index.php?title=Water_Storage&action=edit&mode=wysiwyg&redlink=1#_ftn2 [2]] |
| | | | |
| | There are several means to store harvested water: | | There are several means to store harvested water: |
| Line 12: |
Line 14: |
| | [[File:Infographic illustrating typical cases of storage, 2012, Tuinhof A.jpg|thumb|right|378px|Fig. 1: Infographic illustrating typical cases of storage|alt=Fig. 1: Infographic illustrating typical cases of storage]] | | [[File:Infographic illustrating typical cases of storage, 2012, Tuinhof A.jpg|thumb|right|378px|Fig. 1: Infographic illustrating typical cases of storage|alt=Fig. 1: Infographic illustrating typical cases of storage]] |
| | <div> | | <div> |
| − | '''Factors''' :
| + | == Factors == |
| | | | |
| | The selection of the appropriate method of water storage depends on the following factors: | | The selection of the appropriate method of water storage depends on the following factors: |
| Line 31: |
Line 33: |
| | | | |
| | All other things being equal, the quantity of water collected from water harvesting systems is proportional to its catchment area. Water losses from storage facilities depend upon the material used for construction of storage system and system type. Storage of harvested water is central to many water harvesting systems. The storage structures should be designed to store enough water to meet demand and constructed in such a way to minimize seepage and evaporative losses. The choice of storage system depends on local hydrological, topographical, and [geology]. The best storage system for a given location is the one which supplies enough water to meet demand at the lowest cost per unit of water supplied. | | All other things being equal, the quantity of water collected from water harvesting systems is proportional to its catchment area. Water losses from storage facilities depend upon the material used for construction of storage system and system type. Storage of harvested water is central to many water harvesting systems. The storage structures should be designed to store enough water to meet demand and constructed in such a way to minimize seepage and evaporative losses. The choice of storage system depends on local hydrological, topographical, and [geology]. The best storage system for a given location is the one which supplies enough water to meet demand at the lowest cost per unit of water supplied. |
| | + | |
| | + | == Storage Mechanisms == |
| | | | |
| | Besides soil profile, the following are the most common storage mechanisms used for agricultural rainwater: | | Besides soil profile, the following are the most common storage mechanisms used for agricultural rainwater: |
| Line 60: |
Line 64: |
| | <br/>As the diagramme shows (Fig.3), the natural recharge such as rainfall and evapo(transpi)ration is used to recharge and store groundwater, conserve the soil moisture, harvest and store rainfall and store surface water in reservoirs. Artificial recharge is another way to replenish [[Artificial recharge of groundwater|groundwater aquifers]]. | | <br/>As the diagramme shows (Fig.3), the natural recharge such as rainfall and evapo(transpi)ration is used to recharge and store groundwater, conserve the soil moisture, harvest and store rainfall and store surface water in reservoirs. Artificial recharge is another way to replenish [[Artificial recharge of groundwater|groundwater aquifers]]. |
| | | | |
| − | [[File:3R concept on water storage, 2012, Tuinhof A.jpg|thumb|center|401px|Fig.3: 3R concept (Recharge, Retention, Reuse) on water storage|alt=Fig.3: 3R concept (Recharge, Retention, Reuse) on water storage]] | + | [[File:3R concept on water storage, 2012, Tuinhof A.jpg|thumb|left|484px|Fig.3: 3R concept (Recharge, Retention, Reuse) on water storage|alt=Fig.3: 3R concept (Recharge, Retention, Reuse) on water storage]] |
| | <div> | | <div> |
| − | <br/>'''Costs and Benefits''' | + | == <br/>Costs and Benefits == |
| | | | |
| | The costs that are associated with water storage are mainly the costs of development and the costs of upkeep that arise when the storage measures are to be kept intact. These costs come in monetary form or in form of labour contributions. | | The costs that are associated with water storage are mainly the costs of development and the costs of upkeep that arise when the storage measures are to be kept intact. These costs come in monetary form or in form of labour contributions. |
| Line 70: |
Line 74: |
| | Water Storage is also an adaptation measure to [[Impacts of climate change on agricultural water management|climate change risks]](drought resilience), it helps to reach the Millenium Development Goals (MDGs) in areas with temporal water shortages and it is a response to the UN-resolution on the right to water. | | Water Storage is also an adaptation measure to [[Impacts of climate change on agricultural water management|climate change risks]](drought resilience), it helps to reach the Millenium Development Goals (MDGs) in areas with temporal water shortages and it is a response to the UN-resolution on the right to water. |
| | | | |
| − | [[File:Overview of costs and benefits at different levels, 2012, Tuinhof A.jpg|thumb|center|413px|Fig.4: Overview of costs and benefits at different levels|alt=Fig.4: Overview of costs and benefits at different levels]] | + | [[File:Overview of costs and benefits at different levels, 2012, Tuinhof A.jpg|thumb|left|551px|Fig.4: Overview of costs and benefits at different levels|alt=Fig.4: Overview of costs and benefits at different levels]] |
| | | | |
| | <br/> | | <br/> |
| Line 76: |
Line 80: |
| | A good overview of the different types of benefits and different financing modalities that could apply is presented in Figure 5. | | A good overview of the different types of benefits and different financing modalities that could apply is presented in Figure 5. |
| | | | |
| − | [[File:Most important benefits from buffer management and financial modalities, 2012, Tuinhof A.jpg|thumb|left|509px|Fig.5: Most important benefits from buffer management|alt=Fig.5: Most important benefits from buffer management]] | + | [[File:Most important benefits from buffer management and financial modalities, 2012, Tuinhof A.jpg|thumb|left|446px|Fig.5: Most important benefits from buffer management|alt=Fig.5: Most important benefits from buffer management]] |
| | | | |
| − | '''Examples'''
| + | <br/> |
| | | | |
| − | Water storage is a concept that can be used anywhere and, depending on the location and context, it can be realized in different scales. To exemplify the range of these measures, the following will show how water storage can be done at a small scale in form of sand dams, but also at the level of large-scale infrastructural measures (Managed Aquifer Recharge, MAR).
| + | <br/> |
| | | | |
| − | ''Sand dams in Kitui district/Kenya[http://agriwaterpedia.info/index.php?title=Water_Storage&action=edit&mode=wysiwyg&redlink=1#_ftn1 [7]]''
| + | <br/> |
| | + | |
| | + | <br/> |
| | + | |
| | + | <br/> |
| | + | |
| | + | <br/> |
| | + | |
| | + | <br/> |
| | + | |
| | + | <br/> |
| | + | |
| | + | <br/> |
| | + | |
| | + | <br/> |
| | + | |
| | + | <br/> |
| | + | |
| | + | <br/> |
| | + | |
| | + | <br/> |
| | + | |
| | + | <br/> |
| | + | |
| | + | <br/> |
| | + | |
| | + | <br/> |
| | + | |
| | + | <br/> |
| | + | |
| | + | <br/> |
| | + | |
| | + | <br/> |
| | + | |
| | + | <br/> |
| | + | |
| | + | <br/> |
| | + | |
| | + | <br/> |
| | + | |
| | + | <br/> |
| | + | |
| | + | <br/> |
| | + | |
| | + | <br/> |
| | + | |
| | + | <br/> |
| | + | |
| | + | <br/> |
| | + | |
| | + | <br/> |
| | + | |
| | + | <br/> |
| | + | |
| | + | <br/> |
| | + | |
| | + | == <br/>Examples == |
| | + | |
| | + | Water storage is a concept that can be used anywhere and, depending on the location and context, it can be realized in different scales. To exemplify the range of these measures, the following will show how water storage can be done at a small scale in form of sand dams, but also at the level of large-scale infrastructural measures (Managed Aquifer Recharge, MAR).[http://agriwaterpedia.info/index.php?title=Water_Storage&action=edit&mode=wysiwyg&redlink=1#_ftn1 [7]] |
| | + | |
| | + | === <span lang="en-us">Sand dams in Kitui district/Kenya</span>. === |
| | + | |
| | + | ''[[File:Technical drawing of a sand dam, 2012, Tuinhof A..jpg|thumb|left|371px|Technical drawing of a sand dam]]'' |
| | | | |
| | 400 to 500 sand dams were built by the Kenyan NGO Sahelian Solution Foundation (SASOL) between 1995 and 2005. The costs of the construction of a dam are in the range of USD 8,000-12,000. The figure includes a 30-35% contribution from the community in the form of labour. Additional costs have to be added for the installation of 2-4 dug wells with a hand pump (total USD 2,000- 3, 000). The total investment costs therefore may vary between USD 10,000 - USD 15,000. Annual maintenance and monitoring costs are estimated at about 10% of the investment costs per year. A sand dam provides about 1,500 - 2,000 m3 of storage during a rainy period. Assuming 2 rainy seasons, the total storage capacity is about 4,000 m3/year. On an average, 25 families or about 150 persons use a dam. The benefits of the sand dam have been studied based on data of the socioeconomic situation in a village with (Kindu) and without (Koma) sand dam, and by comparing the situation before (1995) and after (2005) the construction of the dam (table 6). The access to water was improved, thus time for fetching water was reduced and more time was available for agricultural activities. Therefore agricultural and industrial production increased and resulted in more income. For one sand dam (25 families) the net increase in family income was 25*125= USD 3,000/yr. […] | | 400 to 500 sand dams were built by the Kenyan NGO Sahelian Solution Foundation (SASOL) between 1995 and 2005. The costs of the construction of a dam are in the range of USD 8,000-12,000. The figure includes a 30-35% contribution from the community in the form of labour. Additional costs have to be added for the installation of 2-4 dug wells with a hand pump (total USD 2,000- 3, 000). The total investment costs therefore may vary between USD 10,000 - USD 15,000. Annual maintenance and monitoring costs are estimated at about 10% of the investment costs per year. A sand dam provides about 1,500 - 2,000 m3 of storage during a rainy period. Assuming 2 rainy seasons, the total storage capacity is about 4,000 m3/year. On an average, 25 families or about 150 persons use a dam. The benefits of the sand dam have been studied based on data of the socioeconomic situation in a village with (Kindu) and without (Koma) sand dam, and by comparing the situation before (1995) and after (2005) the construction of the dam (table 6). The access to water was improved, thus time for fetching water was reduced and more time was available for agricultural activities. Therefore agricultural and industrial production increased and resulted in more income. For one sand dam (25 families) the net increase in family income was 25*125= USD 3,000/yr. […] |
| | | | |
| | Retaining water in a sand dam costs USD 0.6 - USD 0.8 /m3 on average (table 8); the corresponding investment cost per consumer is USD 17- USD 25/yr. Whether the investment is able to return itself depends on the benefits, discount rate, and the lifetime of the dam. In a typical case, the net present value - indicating the net sum of the annual benefits over the lifetime of the structure - is positive at USD 6,000 after 15 years and USD 10,000 after 20 years. | | Retaining water in a sand dam costs USD 0.6 - USD 0.8 /m3 on average (table 8); the corresponding investment cost per consumer is USD 17- USD 25/yr. Whether the investment is able to return itself depends on the benefits, discount rate, and the lifetime of the dam. In a typical case, the net present value - indicating the net sum of the annual benefits over the lifetime of the structure - is positive at USD 6,000 after 15 years and USD 10,000 after 20 years. |
| | + | |
| | + | <br/> |
| | | | |
| | [[File:Summary of measures benefits, 1000 Khs=14 USD, o=unchanged, +=slightly improved, -=slightly deteriorated, 2012, Tuinhof A.jpg|thumb|center|638px|Fig.6: Summary of measures benefits|alt=Fig.6: Summary of measures benefits]] | | [[File:Summary of measures benefits, 1000 Khs=14 USD, o=unchanged, +=slightly improved, -=slightly deteriorated, 2012, Tuinhof A.jpg|thumb|center|638px|Fig.6: Summary of measures benefits|alt=Fig.6: Summary of measures benefits]] |
| Line 92: |
Line 160: |
| | <br/> | | <br/> |
| | <div> | | <div> |
| − | ''Managed Aquifer Recharge Scheme in Windhoek, Namibia[http://agriwaterpedia.info/index.php?title=Water_Storage&action=edit&mode=wysiwyg&redlink=1#_ftn1 [8]]''
| + | === Managed Aquifer Recharge Scheme in Windhoek, Namibia === |
| | | | |
| | The main objective is to improve the security of the water supply to the Central Area of Namibia. Due to huge evaporation losses from Omataki and Swakoppoort Dams the 95% safe yield is only 13Mm³/year. This is improved by approximately 7.0 Mm³/year to a total of 20.0 Mm³/year thanks to a water transfer to and storage in the Von Bach Dam, which has the lowest evaporation rate. Given the projected increase in demand to approximately 40Mm³ in 2021, managed aquifer recharge of the Windhoek Aquifer has to be done in combination with deep boreholes (Figure 7) to get access to larger volumes of stored reserves. The project intends to take water from the 3-dam system where surplus water is available, then purify it and inject it into the Windhoek Aquifer via the aforementioned boreholes. Lower evaporation and overflow losses at the dams are the results. This creates a water bank, which allows for the abstraction of stored underground water in times when surface sources cannot provide enough water. | | The main objective is to improve the security of the water supply to the Central Area of Namibia. Due to huge evaporation losses from Omataki and Swakoppoort Dams the 95% safe yield is only 13Mm³/year. This is improved by approximately 7.0 Mm³/year to a total of 20.0 Mm³/year thanks to a water transfer to and storage in the Von Bach Dam, which has the lowest evaporation rate. Given the projected increase in demand to approximately 40Mm³ in 2021, managed aquifer recharge of the Windhoek Aquifer has to be done in combination with deep boreholes (Figure 7) to get access to larger volumes of stored reserves. The project intends to take water from the 3-dam system where surplus water is available, then purify it and inject it into the Windhoek Aquifer via the aforementioned boreholes. Lower evaporation and overflow losses at the dams are the results. This creates a water bank, which allows for the abstraction of stored underground water in times when surface sources cannot provide enough water. |
| Line 100: |
Line 168: |
| | The costs for this 15-year artificial recharge scheme amounts to 19.8 million Euros[http://agriwaterpedia.info/index.php?title=Water_Storage&action=edit&mode=wysiwyg&redlink=1#_ftn1 [9]], however the benefits of this water banking are to be seen at a national level. Windhoek is an important contributor to the manufactured goods sector of Namibia (approximately 50% of the USD 620 million in 2006) and if industry would close due to lack of water, the result would be a USD 310 million/year loss to Namibia, based on the 2006 GDP. Therefore it is of vital importance to ensure water security. Moreover, the optimization of production from the dams supplying Windhoek and its aquifer reduces the need to import expensive water from remote sources in the north. Lastly, this scheme is the most cost-effective and environmentally conscious way, as for example a link to the Okavango river would be multiple the costs of the managed aquifer recharge scheme (see Figure 8). | | The costs for this 15-year artificial recharge scheme amounts to 19.8 million Euros[http://agriwaterpedia.info/index.php?title=Water_Storage&action=edit&mode=wysiwyg&redlink=1#_ftn1 [9]], however the benefits of this water banking are to be seen at a national level. Windhoek is an important contributor to the manufactured goods sector of Namibia (approximately 50% of the USD 620 million in 2006) and if industry would close due to lack of water, the result would be a USD 310 million/year loss to Namibia, based on the 2006 GDP. Therefore it is of vital importance to ensure water security. Moreover, the optimization of production from the dams supplying Windhoek and its aquifer reduces the need to import expensive water from remote sources in the north. Lastly, this scheme is the most cost-effective and environmentally conscious way, as for example a link to the Okavango river would be multiple the costs of the managed aquifer recharge scheme (see Figure 8). |
| | | | |
| − | [[File:Costs of water (2011), Tuinhof A.jpg|thumb|674px|Costs of water in 2011|alt=Costs of water in 2011]] | + | [[File:Costs of water (2011), Tuinhof A.jpg|thumb|left|674px|Costs of water in 2011|alt=Costs of water in 2011]] |
| | <div><br/> | | <div><br/> |
| − | ----
| |
| − | <div id="ftn1"></div></div><div><br/>
| |
| | ---- | | ---- |
| | <div id="ftn1"> | | <div id="ftn1"> |
| | + | <br/><br/> |
| | + | |
| | + | <br/> |
| | + | |
| | + | <br/> |
| | + | |
| | + | <br/> |
| | + | |
| | + | <br/> |
| | + | |
| | + | <br/> |
| | + | |
| | + | <br/> |
| | + | |
| | + | <br/> |
| | + | |
| | + | == References == |
| | + | |
| | [http://agriwaterpedia.info/index.php?title=Water_Storage&action=edit&mode=wysiwyg&redlink=1#_ftnref1 [1]] Natual Resources Management and Environment Department, „Water Harvesting”, ''Food and Agriculture Organization of the United Nations [http://www.fao.org/docrep/u3160e/u3160e03.htm#1.2 http://www.fao.org/docrep/u3160e/u3160e03.htm#1.2] definitions and classification ''(accessed July 15, 2013). | | [http://agriwaterpedia.info/index.php?title=Water_Storage&action=edit&mode=wysiwyg&redlink=1#_ftnref1 [1]] Natual Resources Management and Environment Department, „Water Harvesting”, ''Food and Agriculture Organization of the United Nations [http://www.fao.org/docrep/u3160e/u3160e03.htm#1.2 http://www.fao.org/docrep/u3160e/u3160e03.htm#1.2] definitions and classification ''(accessed July 15, 2013). |
| | </div></div></div></div></div><div id="ftn1"><div id="ftn2"> | | </div></div></div></div></div><div id="ftn1"><div id="ftn2"> |
| Line 120: |
Line 204: |
| | [http://agriwaterpedia.info/index.php?title=Water_Storage&action=edit&mode=wysiwyg&redlink=1#_ftnref1 [7]] Example taken from Tuinhof, A., van Steenbergen, F., Vos, P. and L. Tolk, ''Profitfrom Storage, ''[http://www.bebuffered.com/downloads/3R_Profit_from_Storage_2012.pdf http://www.bebuffered.com/downloads/3R_Profit_from_Storage_2012.pdf] , pp.40-43 (accessed July12, 2013). | | [http://agriwaterpedia.info/index.php?title=Water_Storage&action=edit&mode=wysiwyg&redlink=1#_ftnref1 [7]] Example taken from Tuinhof, A., van Steenbergen, F., Vos, P. and L. Tolk, ''Profitfrom Storage, ''[http://www.bebuffered.com/downloads/3R_Profit_from_Storage_2012.pdf http://www.bebuffered.com/downloads/3R_Profit_from_Storage_2012.pdf] , pp.40-43 (accessed July12, 2013). |
| | | | |
| − | [http://agriwaterpedia.info/index.php?title=Water_Storage&action=edit&mode=wysiwyg&redlink=1#_ftnref1 [8]] Example taken from Tuinhof, A., van Steenbergen, F., Vos, P. and L. Tolk, ''Profit from Storage, ''[http://www.bebuffered.com/downloads/3R_Profit_from_Storage_2012.pdf http://www.bebuffered.com/downloads/3R_Profit_from_Storage_2012.pdf]pp.54-57 (accessed July 12, 2013). | + | [http://agriwaterpedia.info/index.php?title=Water_Storage&action=edit&mode=wysiwyg&redlink=1#_ftnref1 [8]] Frank van Steenbergen and Albert Tuinhof, ''Managing the Water Buffer, ''[http://www.bebuffered.com/3rbook.htm http://www.bebuffered.com/3rbook.htm] , p.61(accessed July 15, 2013). |
| − | | + | |
| − | [http://agriwaterpedia.info/index.php?title=Water_Storage&action=edit&mode=wysiwyg&redlink=1#_ftnref1 [9]] Frank van Steenbergen and Albert Tuinhof, ''Managing the Water Buffer, ''[http://www.bebuffered.com/3rbook.htm http://www.bebuffered.com/3rbook.htm] , p.61(accessed July 15, 2013).
| + | |
| | </div></div></div></div> | | </div></div></div></div> |
| | + | <br/>'''Image source:''' |
| | + | |
| | + | Tuinhof, A., van Steenbergen, F., Vos, P. and L. Tolk, ''Profitfrom Storage, ''[http://www.bebuffered.com/downloads/3R_Profit_from_Storage_2012.pdf http://www.bebuffered.com/downloads/3R_Profit_from_Storage_2012.pdf] , pp.40-43 (accessed July12, 2013). |
Water storage is the conservation of surplus water that is collected and stored by means of water harvesting techniques. “Water harvesting in its broadest sense will be defined [here] as the ‘collection of runoff for its productive use’.”[1]
Stored water can either be used for drinking water or for irrigation purposes. For the latter, stored water is used to cover the demand of crops during the dry season or even during dry spells in the rainy season and thereby prolong the cropping period.[2]
[edit] Factors
The selection of the appropriate method of water storage depends on the following factors:
- Topography
- Geology (soil profile characteristics)
- Accessibility for personnel, equipment, and materials
- Costs
- Demand characteristics
Storage requirements must be balanced against the quantity and reliability of precipitation in the area. Storage capacity generally increases as requirements increase and as amounts of available water decrease and become less reliable. Storage requirements can usually be estimated based on the purpose for which the water is to be used [irrigation, drinking water or industrial use], use periods, and water requirement of the intended use (i.e. demand).
All other things being equal, the quantity of water collected from water harvesting systems is proportional to its catchment area. Water losses from storage facilities depend upon the material used for construction of storage system and system type. Storage of harvested water is central to many water harvesting systems. The storage structures should be designed to store enough water to meet demand and constructed in such a way to minimize seepage and evaporative losses. The choice of storage system depends on local hydrological, topographical, and [geology]. The best storage system for a given location is the one which supplies enough water to meet demand at the lowest cost per unit of water supplied.
[edit] Storage Mechanisms
Besides soil profile, the following are the most common storage mechanisms used for agricultural rainwater:
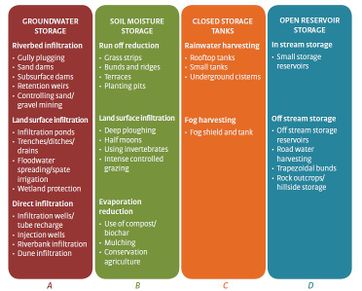
Fig.2: Overview of storage techniques
- above ground storage (jars, vessels, prefabricated tanks etc.)
- surface/ground[water] storage
- ponds
- hafairs
- tanks (India, Sri Lanka)
- reservoirs (behind damns across wadis)
- subsurface/underground storage
- cisterns (natural or man-made caves or constructed cisterns made of concrete or bricks)
- sand-filled reservoirs
- percolation dams/shallow aquifer artificial recharge
- underground dams“[4]
As the diagramme shows (Fig.3), the natural recharge such as rainfall and evapo(transpi)ration is used to recharge and store groundwater, conserve the soil moisture, harvest and store rainfall and store surface water in reservoirs. Artificial recharge is another way to replenish groundwater aquifers.
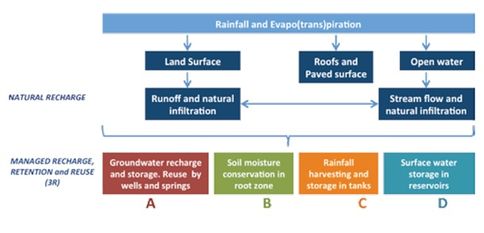
Fig.3: 3R concept (Recharge, Retention, Reuse) on water storage
[edit]
Costs and Benefits
The costs that are associated with water storage are mainly the costs of development and the costs of upkeep that arise when the storage measures are to be kept intact. These costs come in monetary form or in form of labour contributions.
However, the benefits easily outweigh the costs. The degree to which a water management program is actually beneficial depends on the nature of investments made. For example, water storage benefits the local economy by providing employment through external financing, in which case the contribution to the local economy is high. [5] Especially when labour is being remunerated in form of cash instead of food, the local cash flow in cash-starved and undercapitalized poor rural areas is ‘fueled’. [6] Other important benefits include higher crop yields, less loss of soil fertility, less distress due to failed harvests, less loss of herds and thus economically valuable livestock, and no soil degradation. Hence, water storage provides a buffer that can be utilized in times of scarcity. Moreover, these benefits contribute to, not only, economic improvements, but also to food security.
Water Storage is also an adaptation measure to climate change risks(drought resilience), it helps to reach the Millenium Development Goals (MDGs) in areas with temporal water shortages and it is a response to the UN-resolution on the right to water.
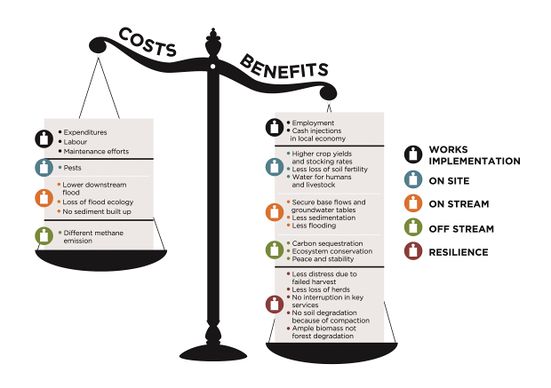
Fig.4: Overview of costs and benefits at different levels
A good overview of the different types of benefits and different financing modalities that could apply is presented in Figure 5.
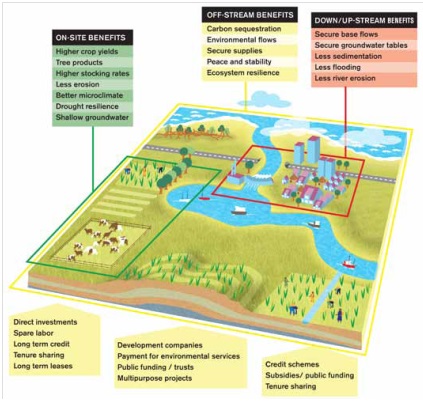
Fig.5: Most important benefits from buffer management
[edit]
Examples
Water storage is a concept that can be used anywhere and, depending on the location and context, it can be realized in different scales. To exemplify the range of these measures, the following will show how water storage can be done at a small scale in form of sand dams, but also at the level of large-scale infrastructural measures (Managed Aquifer Recharge, MAR).[7]
[edit] Sand dams in Kitui district/Kenya.
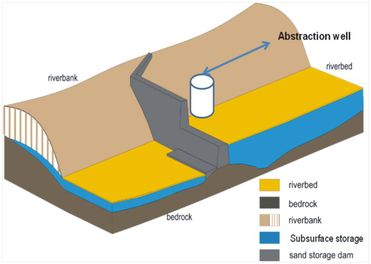
Technical drawing of a sand dam
400 to 500 sand dams were built by the Kenyan NGO Sahelian Solution Foundation (SASOL) between 1995 and 2005. The costs of the construction of a dam are in the range of USD 8,000-12,000. The figure includes a 30-35% contribution from the community in the form of labour. Additional costs have to be added for the installation of 2-4 dug wells with a hand pump (total USD 2,000- 3, 000). The total investment costs therefore may vary between USD 10,000 - USD 15,000. Annual maintenance and monitoring costs are estimated at about 10% of the investment costs per year. A sand dam provides about 1,500 - 2,000 m3 of storage during a rainy period. Assuming 2 rainy seasons, the total storage capacity is about 4,000 m3/year. On an average, 25 families or about 150 persons use a dam. The benefits of the sand dam have been studied based on data of the socioeconomic situation in a village with (Kindu) and without (Koma) sand dam, and by comparing the situation before (1995) and after (2005) the construction of the dam (table 6). The access to water was improved, thus time for fetching water was reduced and more time was available for agricultural activities. Therefore agricultural and industrial production increased and resulted in more income. For one sand dam (25 families) the net increase in family income was 25*125= USD 3,000/yr. […]
Retaining water in a sand dam costs USD 0.6 - USD 0.8 /m3 on average (table 8); the corresponding investment cost per consumer is USD 17- USD 25/yr. Whether the investment is able to return itself depends on the benefits, discount rate, and the lifetime of the dam. In a typical case, the net present value - indicating the net sum of the annual benefits over the lifetime of the structure - is positive at USD 6,000 after 15 years and USD 10,000 after 20 years.
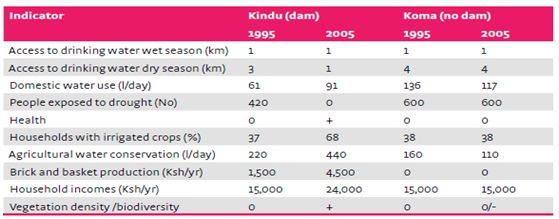
Fig.6: Summary of measures benefits
[edit] Managed Aquifer Recharge Scheme in Windhoek, Namibia
The main objective is to improve the security of the water supply to the Central Area of Namibia. Due to huge evaporation losses from Omataki and Swakoppoort Dams the 95% safe yield is only 13Mm³/year. This is improved by approximately 7.0 Mm³/year to a total of 20.0 Mm³/year thanks to a water transfer to and storage in the Von Bach Dam, which has the lowest evaporation rate. Given the projected increase in demand to approximately 40Mm³ in 2021, managed aquifer recharge of the Windhoek Aquifer has to be done in combination with deep boreholes (Figure 7) to get access to larger volumes of stored reserves. The project intends to take water from the 3-dam system where surplus water is available, then purify it and inject it into the Windhoek Aquifer via the aforementioned boreholes. Lower evaporation and overflow losses at the dams are the results. This creates a water bank, which allows for the abstraction of stored underground water in times when surface sources cannot provide enough water.
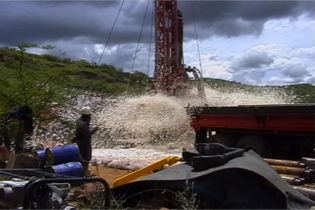
Fig.7: Drilling of deep boreholes to increase access to a larger volume of stored groundwater
The costs for this 15-year artificial recharge scheme amounts to 19.8 million Euros[9], however the benefits of this water banking are to be seen at a national level. Windhoek is an important contributor to the manufactured goods sector of Namibia (approximately 50% of the USD 620 million in 2006) and if industry would close due to lack of water, the result would be a USD 310 million/year loss to Namibia, based on the 2006 GDP. Therefore it is of vital importance to ensure water security. Moreover, the optimization of production from the dams supplying Windhoek and its aquifer reduces the need to import expensive water from remote sources in the north. Lastly, this scheme is the most cost-effective and environmentally conscious way, as for example a link to the Okavango river would be multiple the costs of the managed aquifer recharge scheme (see Figure 8).